Juice Shop
Assume you’ve opened a “juice shop”, and you want to improve your business.
If you are smart enough, you’ll start recording sales data to understand your business.
What kind of data you’ll record?
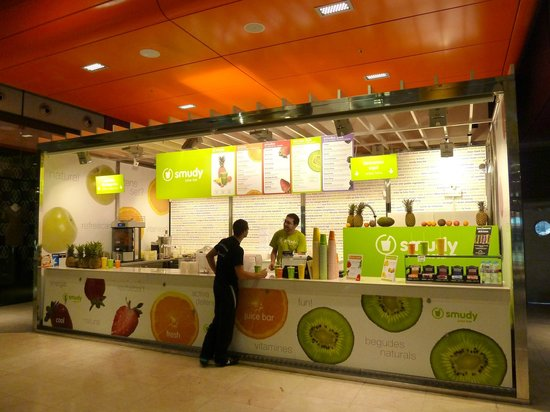
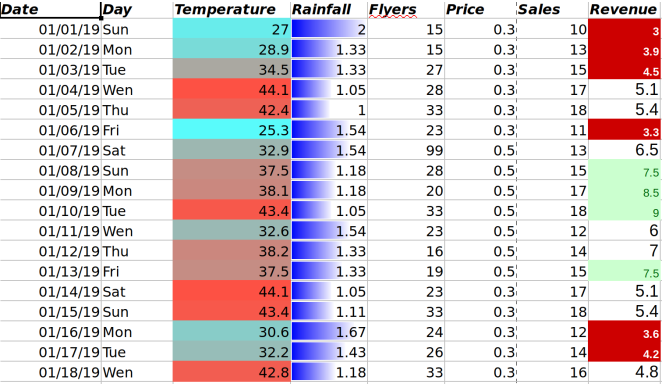
Collecting Data
-
Temporal data
-
Text data
-
text
-
categorical
-
-
Numerical data
-
Continuous
-
Discrete
-
Categorical
-
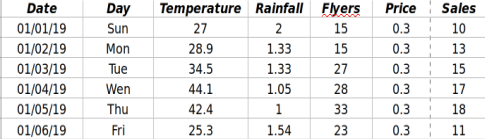
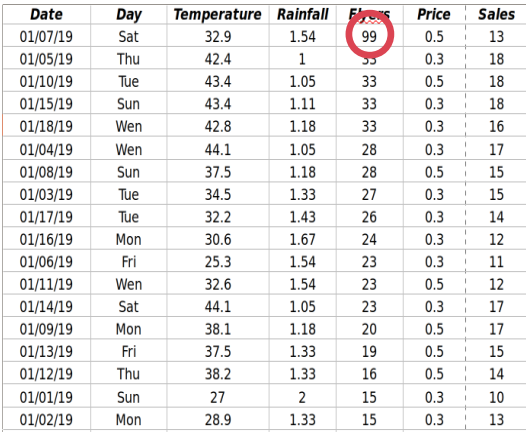
Sorting Data
Sorting by Sales
Or based on Flyers
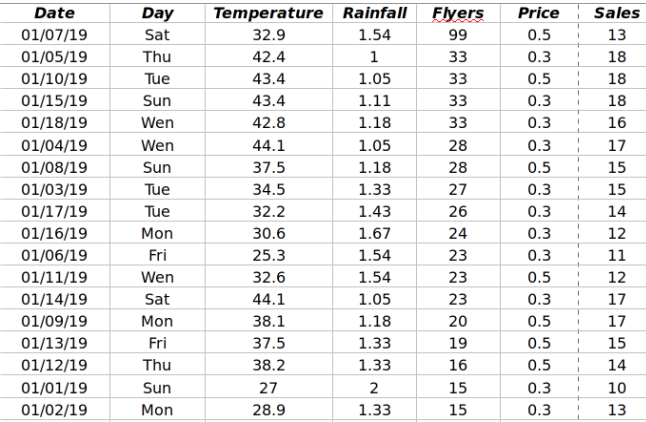
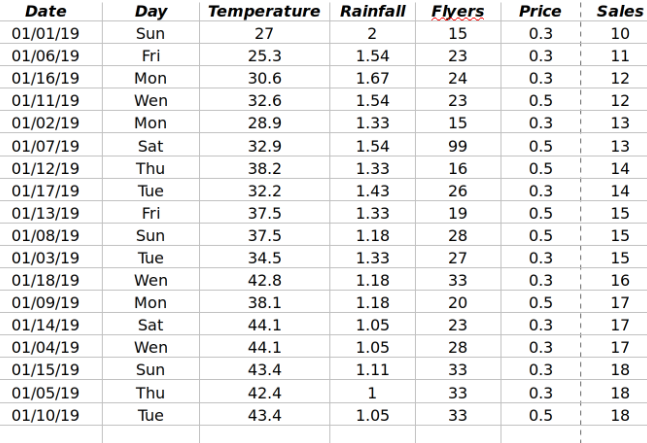
Outliers:
-
Data points far away from others
-
Outliers can largely affect the analysis.
-
Outliers might be mistakes or very rare
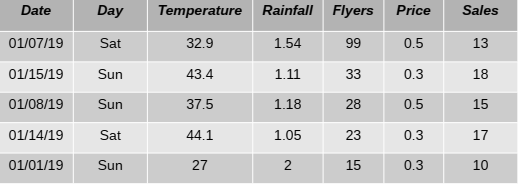
Filtering
We can filter data based on any criteria on any of the fields.
- Day=’Sat’ or ‘Sun
- Temperature < 30
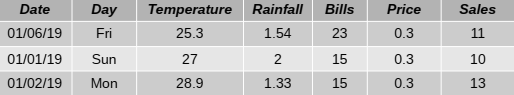
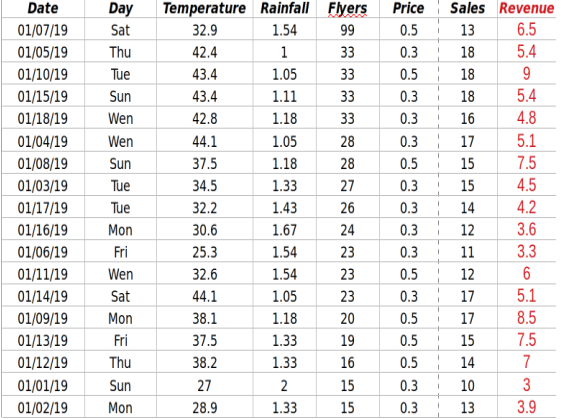
Drive values from existing data
-
You can do any kind of calculation on any field
-
Change temperature from C° to F°
-
Adding a Month field
-
-
Or generate a new field by combining already existing fields
- Revenue: Sales*Price
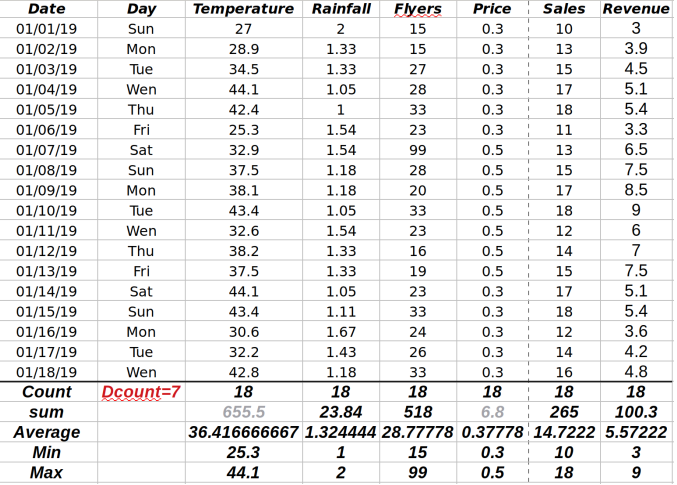
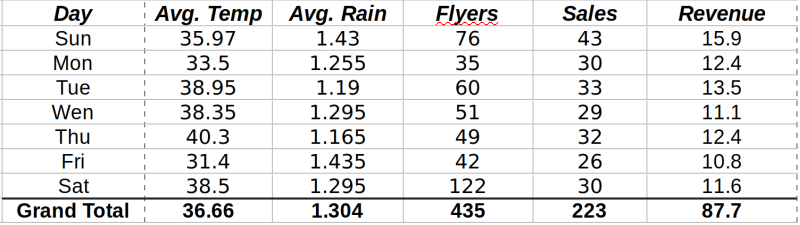
Aggregating data
- We can use aggregating functions (e. g., sum) to summarize data and get feel as a whole.
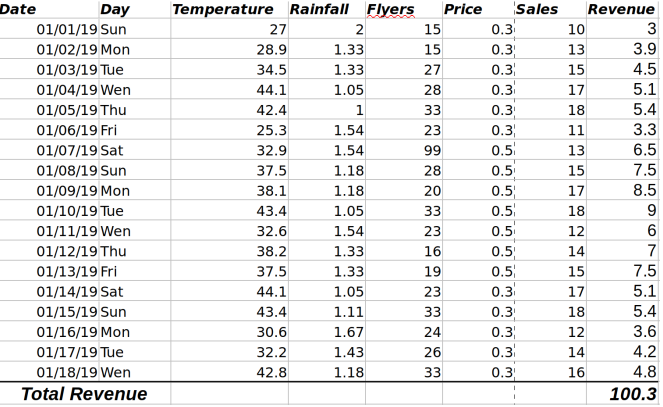
- Count, Distinct Count, Sum, Min, Max
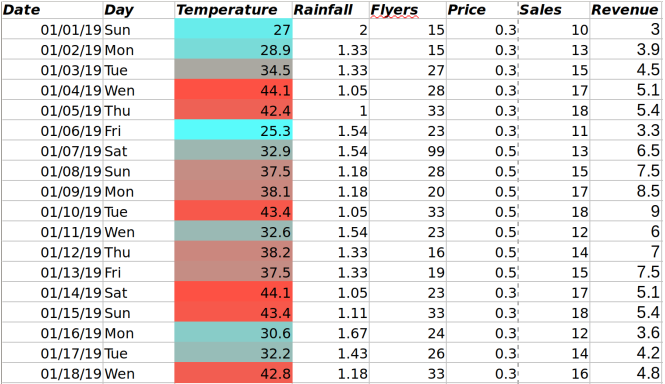
Highlighting Data
Interpreting numbers in large tables is difficult.
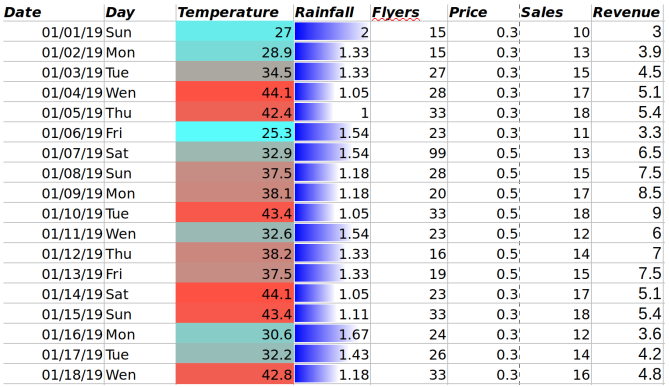
- We can use heatmaps to visualize the scale of values
- We can use “data bars” to visualize the scale of values
-
We can highlight individual values that fall within sum criteria:
- e. g., top 30% (good days) and less 30% (bad days) Revenues
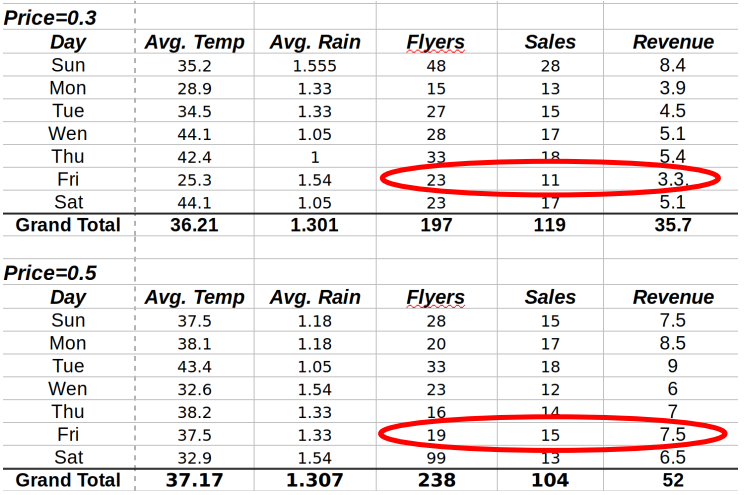
Grouping Data
It is common to group data by categorical fields and compute subtotal values
On more than one field
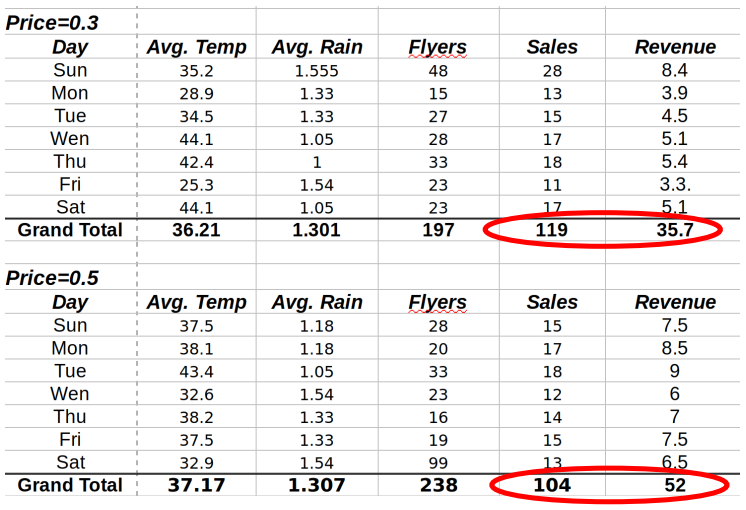
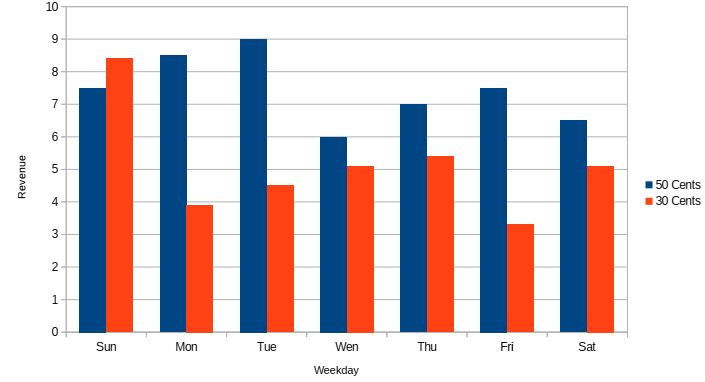
Is Price=50 always better?
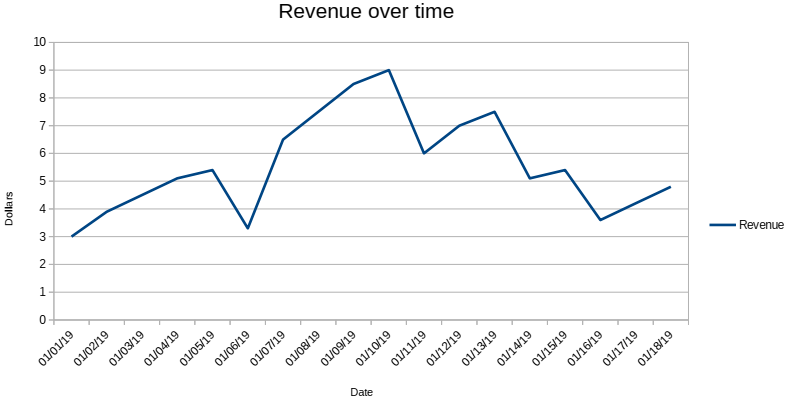
Visualization
- Line plot
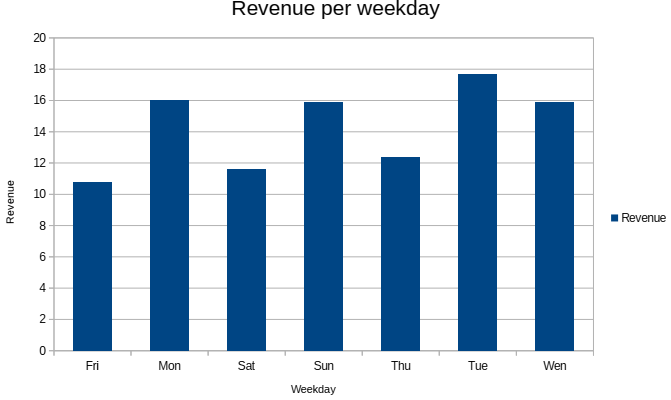
- Column chart
- Joint column chart
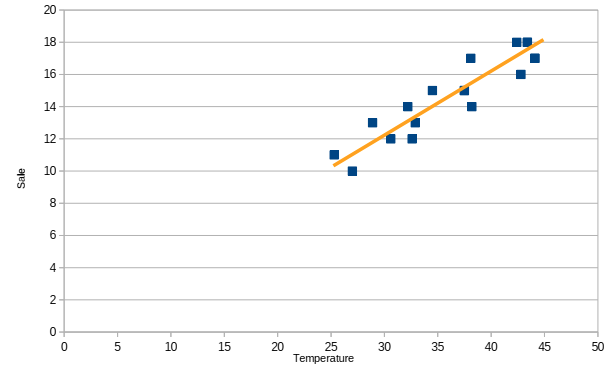
- Scater plot
Statistical analysis
Statistics is the core of data science.
Using Statistics:
-
You can see the distribution of the data
-
How much variance there is between values
-
How changes in one feature affect values of other features
The first point to start is descriptive statistics